
FEMA maps showing full flood risk to Vermont communities could remain out of date for years
")
FILE - Jodi Kelly, seated center, practice manager at Stonecliff Veterinary Surgical Center, behind, and her husband Veterinarian Dan Kelly, right, use a canoe to remove surgical supplies from the flood damaged center, July 11, 2023, in Montpelier, Vt. The supplies included orthopedic implants for an upcoming surgery on a dog. (AP Photo/Steven Senne, File) ap file — Steven Senne
| Published: 08-30-2023 7:04 PM |
On Tuesday, dozens of Montpelier residents gathered to discuss ideas for improving the city’s relationship with the three rivers that run inside its borders.
The stakes were high. Just over a month earlier, Montpelier had been inundated with 4 to 6 feet of floodwaters, destroying or damaging large portions of the downtown area and residential neighborhoods.
Amid discussion of building up water infrastructure and restoring upstream floodplains, one key question circled: How far and how high did the flood go exactly?
One resident, who did not give his full name, made a request for “accessible and easy-to-understand maps” that could tell Montpelierites “where did the rain come from that comes into the city?”
Those maps, to an extent, already exist. The Federal Emergency Management Agency maintains the largest database of estimated flood hazards in the nation, including for Montpelier and many other Vermont communities.
The data that powers these maps — the data that determines federal regulations on flood insurance and community participation in flood programs — is collected through a painfully in-depth and yearslong process of studying the hydrology and geology of every section of river in Vermont.
Which is why, according to FEMA, many of these maps are years or even decades out of date.
One of the latest flood studies in Vermont, for Washington County, was completed in 2013, according to FEMA’s flood study website. But because the study took years to complete, it doesn’t even include data on what happened during Tropical Storm Irene 12 years ago or during a May 2011 rainstorm that flooded Montpelier with several inches of water.
Article continues after...
Yesterday's Most Read Articles
 Dartmouth administration faces fierce criticism over protest arrests
 Hanover house added to New Hampshire Register of Historic Places
 Sharon voters turn back proposal to renovate school
In other locations in Vermont, far older studies power their flood maps. Windham County, with communities hit hard in Tropical Storm Irene, hasn’t had an update since 2007. Some flood studies date all the way back to 1977, during the decade when the maps were first created by regulatory mandate.
FEMA redoes its flood studies on a rolling basis for different communities, said Kerry Bogdan, a spokesperson for the agency. She cited budget constraints as one reason for the delays.
“Congress does not give the agency enough money to, every time they do a study, to update the engineering on every single flooding source within that geography,” she said.
At least 13 Vermont watersheds are in the process of having flood studies right now, said Chris Hutchins, a senior program specialist who works on flood maps for FEMA. The furthest along is the Deerfield River watershed study in Bennington County, where FEMA recently released preliminary maps for communities to review.
But the 2023 floods are not yet included in those studies, and it’s unclear at this point if and how they will be. Bogdan said FEMA has commissioned a separate study to review the data from the 2023 floods and evaluate if they would invalidate or complicate the other ongoing flood studies.
Either way, new maps are still years away from the finish line. Hutchins said the earliest Vermont can expect finalized maps would be 2025 or 2026, “barring no hiccups.”
Bogdan pointed out that data from historic floods is only one component of flood studies. Changes in the topology of the area, or in water-related infrastructure like culverts and dams, also determine when and how flood studies are conducted.
FEMA develops a “prioritization” schedule based on engineering and conversations with local officials about what’s been observed on the ground, she said.
Researchers across the country are looking at ways to make the process for determining flood risk go faster. In a 2021 paper on alternative flood models, University of Vermont researcher Rebecca Diehl called the traditional process “insufficient” and “data- and resource-intensive.”
In an email to VTDigger, she said there are numerous challenges with the current system — including the amount of data collection needed to detail the risk faced by specific properties.
“We make decisions (and) tradeoffs between getting these details right and capturing the general inundation patterns that are likely to occur,” she said via email.
Under the National Flood Insurance Act of 1968, FEMA was given a specific goal when creating flood maps: To determine whether specific property owners were required to purchase flood insurance because they were in a high-risk flood zone.
These Special Flood Hazard Areas, sometimes referred to as 100-year flood zones, also determine how communities in the National Flood Insurance Program regulate development in floodplains.
But the “100-year flood” term is a bit of a misnomer. Bogdan said the agency has moved away from using that term in favor of calling those areas “1% annual chance events.” In other words, that flood has a 1% annual chance of occurring.
“People think it’s only going to happen in every 100 years, right like it happened in 1927. So we shouldn’t be dealing with it again until 2027, right?” she said. But in actuality, “unfortunately, you could have 100-year, or a 1% chance, flood three times in a month, three times in a year. (Or) you could have 100 years go by and never experience that.”
Another way FEMA describes it: If a homeowner has a 30-year mortgage, there’s a one-in-three chance that a flood will reach the ground floor before the mortgage is paid off.
Those chances are further complicated by the fact that up to 40% of flood insurance claims come from outside of flood zones, according to FEMA. Vermonters in the recent floods have reported that they were affected, even though their homes were outside the FEMA flood zones.
Conversely, some Vermont communities have a greater than 1% annual chance of flooding, although it’s not marked on the FEMA flood maps. A review of flood studies for Washington County, for example, reveals that some roads and bridges have a 2% chance or even a 10% chance of flooding each year.
In recent years, the biggest challenge to how FEMA flood maps are created has come from climate research groups, which claim the agency underestimates flood risk by not taking into account how climate change could increase the chances of extreme weather.
First Street Foundation, a nonprofit that publishes and sells risk factor data, estimates that 15% of Vermont properties are located in a 1% annual chance flood zone, compared to FEMA’s 1.6% to 8% of properties, depending on the county.
“In the absence of a property-specific risk model, (FEMA maps) have been used as a default tool for understanding property-specific flood risk. And because of that, you know, they’re really being used for something they’re not designed for,” said Jeremy Porter, head of climate implications at First Street Foundation.
The nonprofit organization incorporates real-world data on river heights, elevation and property zones, but makes different assumptions than FEMA does about the likelihood of extreme weather events, Porter said. It provides free data on its website and sells more in-depth, premium data at an additional cost.
Diehl, the UVM researcher, said via email that climate change means “catastrophic storms” will become more common, shifting the meaning of the 1% flood zone and expanding areas that are regularly flooded.
While flood maps are based on river flooding, she said, the traditional models do not account for flooding that comes directly from hard, fast rain, which is more likely during intense storms. One example would be the flash flooding that occurred in Addison County during heavy rainstorms in early August.
Porter said that, by calculating the chance of extreme weather in a particular area based on historical events, “you’re inherently taking the average of a period that’s already passed.”
“If you don’t incorporate climate metrics that allow you to understand the trending in that data over time, and integrate that into the future, then you end up missing both what the current risk is and what the future risk is,” he said.
Diehl has worked to develop new methods of calculating flood risk that could be performed more quickly and with less detailed data. Her model is a low-complexity system that doesn’t produce enough accuracy for the flood insurance program, but could provide a better overview for communities to prioritize flood hazard areas and test mitigation systems, according to the study detailing the model.
The biggest challenge for First Street Foundation is getting more high-quality data to adopt into its modeling in the first place, Porter said. “The flood model is only going to be as good as the data that you put into the model,” he said, and the organization is continually updating it with factors such as new developments and new elevation levels.
FEMA officials said their hands are tied by that flood insurance law.
“These products are regulatory because of insurance requirements,” Bogdan said. “So we are not … allowed to include future forecasted conditions into these particular products.”
In an email statement, FEMA said “the accuracy of the flood data necessary to service the nation’s largest flood insurance program and the nation’s largest regulatory land use program is fundamentally different than the level of accuracy necessary to support First Street Foundation.”
So with all those factors in mind, should communities and homeowners trust the flood maps?
As Porter sees it, “all climate is local,” so communities need to understand their specific environment and climate conditions in order to take action. Different regions have taken very different approaches to adapting for flooding hazards — from wetlands management in Maine to a massive underground water-detention system near Chicago.
He suggested incorporating “as many data sources as you can” in order to understand your risks.
Diehl wrote that, short of “specific projections” of flood characteristics under a changing climate, communities should consider “taking a conservative approach” — for example, making 500-year or 0.2% chance floods the target to plan for.
“It is likely that the frequency of these larger-magnitude flood events, the ones that cause widespread damage, is likely to increase,” she said via email. “The relatively close spacing in time of Irene and this more recent storm highlights this reality.”
 Art Notes: Canaan Meetinghouse showcase brings musicians and listeners together
 A Look Back: Upper Valley dining scene changes with the times
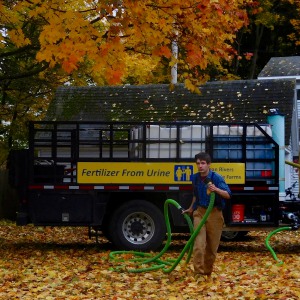 The future of fertilizer? Pee, says this Brattleboro institute
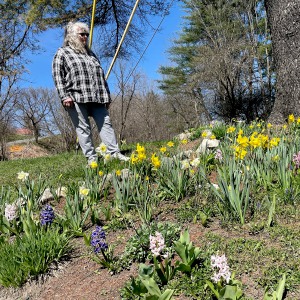 From dirt patch to a gateway garden, a Randolph volunteer cultivates community